
COVID-19: Numbers have meaning
The media is taking lots of data from various sources and turning it into information in an effort to help the general public understand what is happening. However, a number of media outlets are not reporting the definition of a particular figure accurately. As an example, the identical single figure for deaths is being reported in the same publications as being both “from” COVID-19, and “with” COVID-19. Two entirely different concepts.
When this pandemic is over there will be lots of people trying to make sense of the data. One of the likely measures will be deaths per 1m of the population. Comparing total deaths to a fixed measure of the population will give a better sense of the effects than simply using the figure for total deaths by itself.
This article is not attempting to analyse the current data. The purpose of the article is to explain why looking at a single figure and drawing conclusions is not giving the complete picture, why understanding the definitions behind each data element is important, and, in the case of England and Wales, how the data is collected.
Is the data fit for purpose?
Fortunately, in England and Wales the Office of National Statistics (ONS) follows good practice.
In data standards we talk about the quality of data being defined as its “fitness for purpose”. More specifically in the case of ONS data, it is the fitness for purpose with regards to the European Statistical System dimensions of quality:
- relevance – the degree to which a statistical product meets user needs in terms of content and coverage;
- accuracy and reliability – how close the estimated value in the output is to the true result;
- timeliness and punctuality: the time between the date of publication and the date to which the data refers, and the time between the actual publication and the planned publication of a statistic;
- accessibility and clarity – the ease with which users can access data, and the quality and sufficiency of metadata, illustrations and accompanying advice:
- coherence and comparability – the degree to which data derived from different sources or methods, but that refers to the same topic, is similar, and the degree to which data can be compared over time and domain, for example, geographic level;
and two other important dimensions:
- output quality trade-offs; and
- assessment of user needs and perceptions.
The ONS issues comprehensive data sets free of charge so that detailed analysis can be carried out by third parties.
How the ONS report deaths in England and Wales
The ONS produce summary information on annual deaths. The following table lists the number of deaths each year in England and Wales between 2014 and 2018.
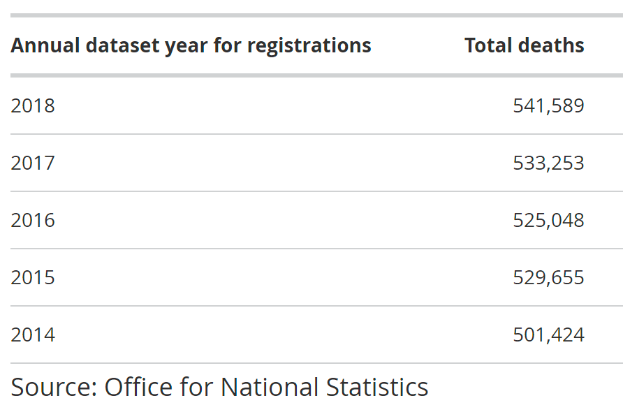
The general rise in these figures is something to bear in mind when reviewing the average number of deaths during this period when compared to the five-year average, and is another reason why using the number of deaths per million gives better context to the figures. According to the ONS, the population of England and Wales in mid-2014 was 57,408,600, and in mid-2018 it was 59,115,809, an increase of 1,707,209. When the mid-2018 data set was published, the ONS noted that “Since mid-2000, the population of the UK has grown by almost 7.5 million and there are 2.4 million more people aged 65 to 84 years and 489,000 more aged 85 years or over.” Annual population updates are normally published by the ONS in the last week of June.
The ONS also records “excess winter deaths”. In the 2018 to 2019 winter period (December to March), there were an estimated 23,200 EWD in England and Wales. This was substantially lower than the 49,410 EWD observed in the 2017 to 2018 winter and lower than all recent years since 2013 to 2014 when there were 17,280 EWD.
How the ONS is reporting deaths involving COVID-19
As a result of the current pandemic, the ONS currently provides a separate breakdown of the numbers of deaths involving COVID-19. That is, where COVID-19 or suspected COVID-19 was mentioned anywhere on the death certificate, including in combination with other health conditions. If a death mentions COVID-19, it will not always be the main cause of death, it will sometimes be a contributary factor. The conditions mentioned on the death certificate are used to derive an underlying cause of death.
Mortality statistics in England and Wales are derived from the registration of deaths certified by a doctor or a coroner. Deriving conditions from a death certificate introduces a known variable; the accuracy of the data drawn from the certificate is dependent on the doctor completing the certificate. Before submitting a death registration through the Registration Online (RON) system, the registrar will verify that all the information provided has been entered accurately. There are some automatic validation checks within RON to help the registrar with this process. The cause of death reported represents the final underlying cause of death. This takes account of additional information received from medical practitioners or coroners after the death has been registered.
The authoritative source in England and Wales for the certification of births, marriages, and deaths is the General Register Office (GRO). The GRO pass death registration information to the ONS electronically, and the ONS: codes; compiles; and publishes these figures weekly.
The ONS short list for cause of death is based on a standard tabulation list developed in consultation with the Department of Health. This list of over 100 conditions was based on the following:
- all conditions given in the World Health Organization (WHO) basic tabulation list; with the exception of a few conditions that are so rare as certified causes of death in England and Wales that they could safely be excluded from the list;
- totals for each International Classification of Diseases, Tenth Revision (ICD-10) chapter;
- conditions used in monitoring public health targets;
- other conditions often cited by ONS.
Currently, in the UK The Department of Health and Social Care (DHSC) release daily updates on the GOV.UK website counting the total number of deaths reported to them that have occurred in hospitals among patients who have tested positive for the coronavirus (COVID-19) up until 5pm the day before.
Since 2 April, NHS England have been releasing daily updates of deaths in hospitals among patients who have tested positive for COVID-19 in England, which includes updates on previous days numbers.
The Office for National Statistics (ONS) provides figures based on all deaths registered involving COVID-19 according to death certification, whether in or out of hospital settings.
At the time of publication, further work is in progress across government to reconcile all sources of COVID-19 deaths data, but as you can see these figures are not directly comparable.
The figures produced by the ONS are about two to three weeks behind the daily reported deaths.
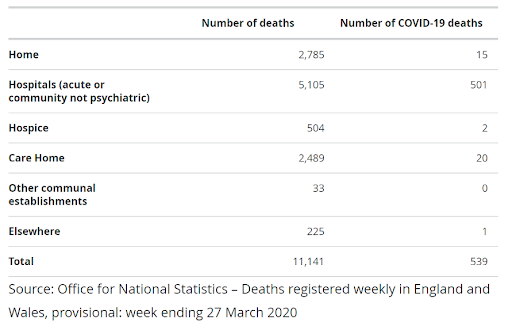
There has been a lot of speculation regarding the number of deaths in care homes. The ONS publishes this data.
There has also been speculation regarding whether influenza and pneumonia deaths are recorded each year. They are:
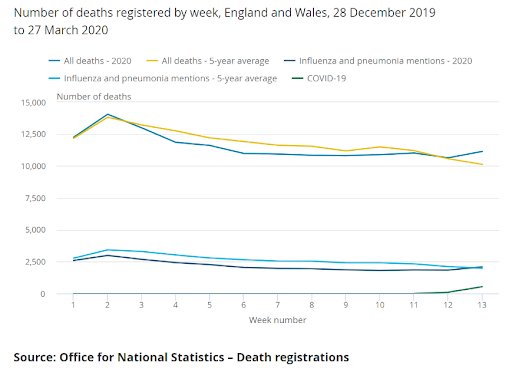
One point to note here is that the reporting of deaths involving COVID-19 is more comprehensive than the previous reporting of respiratory infections, so any comparison of these figures should make this point.
The England and Wales ONS is very clear on how it compiles the information it publishes. Authoritative data sources are always the best places to go start your search for data. Authoritative sources are normally very clear about the definitions for the data they publish, and very open about the methodologies they use. I was visiting the Korean Data Agency in Seoul at the start of this outbreak, and saw first hand how they operate. The ONS is very open, their website (www.ons.gov.uk) is a mine of useful information, and much of the text in this article describing how the numbers have been derived has been drawn from various parts of that site.
Social statisticians studying this mortality figures from pandemic will have lots of data to analyse in the future. They will also look at comparing population density rates as well as the number of deaths per million. They will also adjust the figures for the variability of testing – in both quantity and quality of the tests. The total mortality figures you read about now will have more context in the future.
How is COVID-19 data recorded where you are?
I would be very interested to hear from my fellow data experts in other countries, as to how their deaths are being recorded and published by their data agencies, and if their officially published figures for COVID-19 include deaths “involving COVID-19” where COVID-19 is not the main cause of death. Looking at the deaths per million of population figures published to date, there are some interesting variances that may be explained by the way the data is collected.
When the data is analysed in the coming years, we will need detailed quality data with clear definitions. There will be lots of variances, certain types of deaths will rise, others will fall. We will need to make sure we are comparing like numbers before we draw conclusions. This is vital to enable accurate decisions to be made about managing, or even preventing future pandemics.

About the author
Peter Eales is a subject matter expert on MRO (maintenance, repair, and operations) material management and industrial data quality. Peter is an experienced consultant, trainer, writer, and speaker on these subjects. Peter is recognised by BSI and ISO as an expert in the subject of industrial data. Peter is a member ISO/TC 184/SC 4/WG 13, the ISO standards development committee that develops standards for industrial data and industrial interfaces, ISO 8000, ISO 29002, and ISO 22745. Peter is the project leader for edition 2 of ISO 29002 due to be published in late 2020. Peter is also a committee member of ISO/TC 184/WG 6 that published the standard for Asset intensive industry Interoperability, ISO 18101.
Peter has previously held positions as the global technical authority for materials management at a global EPC, and as the global subject matter expert for master data at a major oil and gas owner/operator. Peter is currently chief executive of MRO Insyte, and chairman of KOIOS Master Data.
KOIOS Master Data is a world-leading cloud MDM solution enabling ISO 8000 compliant data exchange
MRO Insyte is an MRO consultancy advising organizations in all aspects of materials management