

Introduction to SPIR challenges
Introduction to SPIR challenges
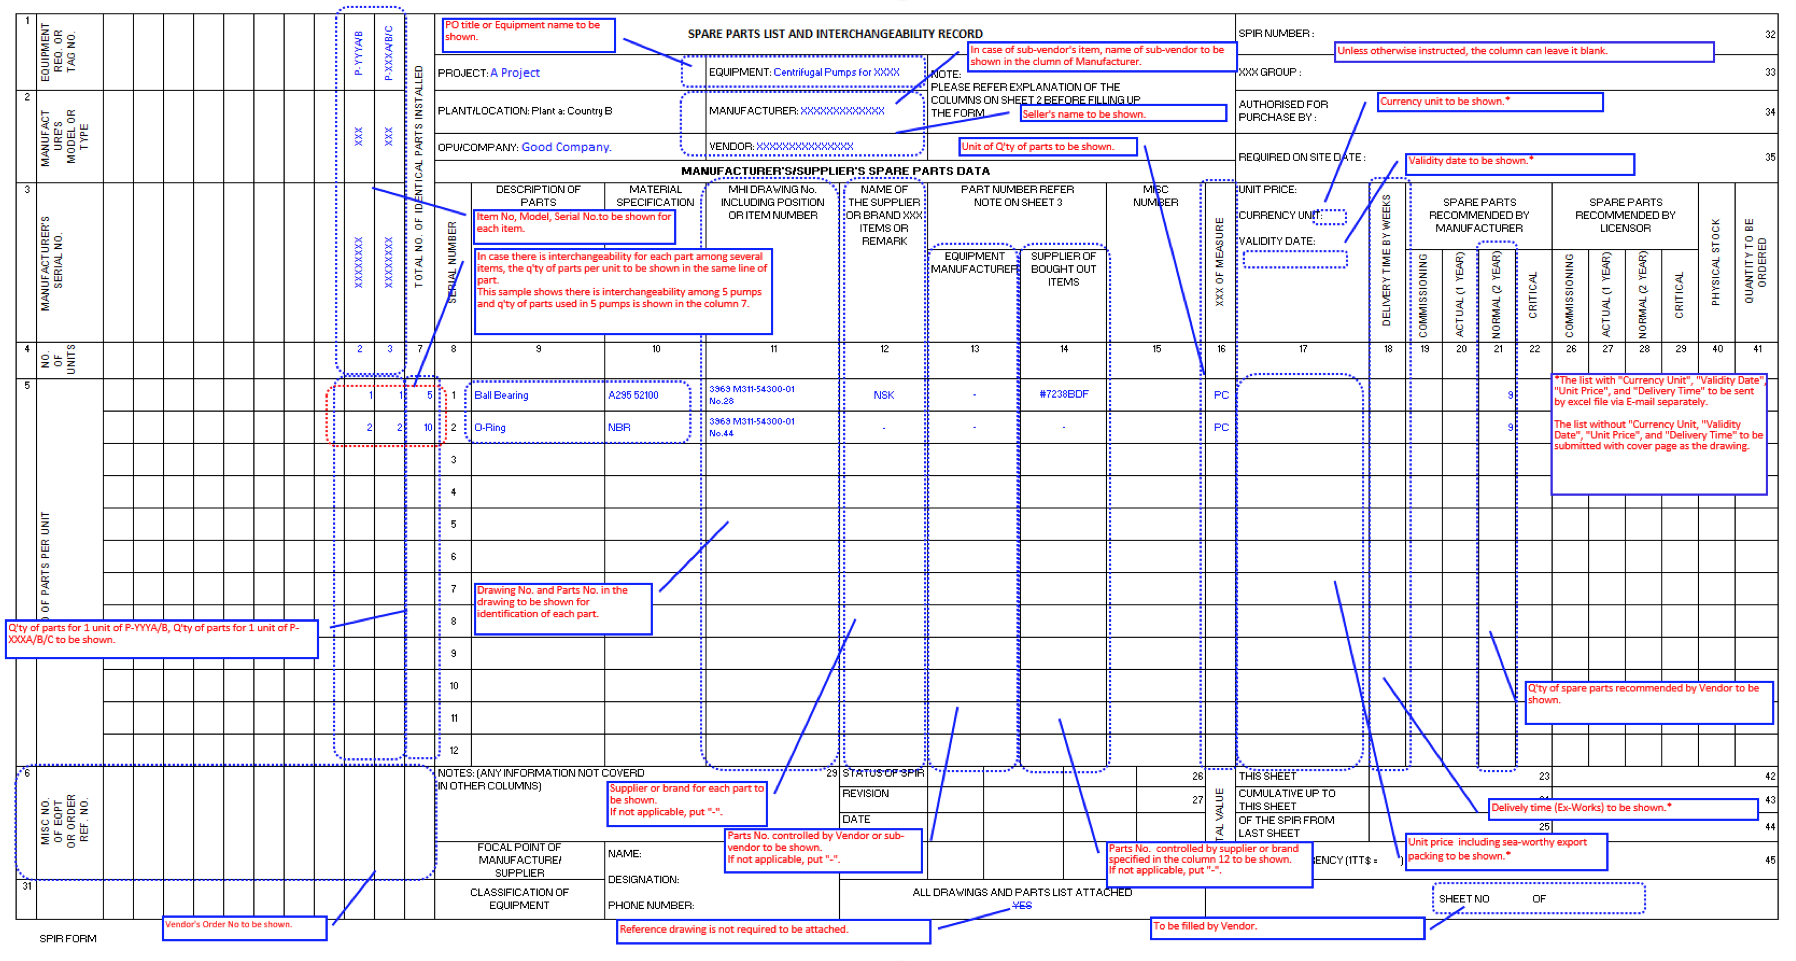
In capital projects generally, and in the oil and gas upstream sector in particular, the transition from engineering design to operational readiness hinges significantly on the accurate and timely provision of Spare Parts Interchange Lists (SPILs), also known as Spares Part as Spares Parts Lists and Interchangeability Records (SPIRs) or Recommended Spare Parts Lists (RSPLs). These critical documents, furnished by Equipment Manufacturers (OEMs) via Engineering Procurement Contractors (EPCs), lay the groundwork for operational efficiency and risk mitigation.
Late delivery and inconsistencies of SPIR documents
A prevalent issue facing plant operators is the delayed release of SPIR documents by EPCs, often at the project’s conclusion or omitted entirely despite contractual penalties. This delay hampers the operator’s ability to procure long-lead items promptly and accurately forecast warehouse requirements for greenfield projects. The format inconsistency of SPIRs, stemming from their evolution from paper forms to spreadsheets, further complicates data extraction due to non-standardization and frequent edits.
Moving beyond spreadsheets
A study of numerous SPIR documents illustrates the inherent flaws in traditional SPIR documentation such as: differing formats leading to difficulties in the extractability of the data, vague product descriptions, general poor data quality in most data fields, and the absence of equipment criticality details and maintenance capabilities. Such deficiencies underscore the urgent need for a paradigm shift towards standardized, digital data exchange protocols that ensure data integrity and accessibility.
In one example, from a single 62-line SPIR document, the term O-ring (as per ISO 5598:2019) is described incorrectly in four different ways (“O” Ring, ORing, O Ring, and O-Ring). The material and the shore hardness were missing from the details, and although the dimensions were included it is impossible to safely order this common consumable item from any other supplier.
The imperative for high-quality data
To address the data challenges inherent in spreadsheets based SPIR documents, organizations should embrace international data exchange standards, such as the ISO 8000 series. This approach advocates for supplier-led data specification in computable formats, grounded in the provenance of data to eliminate ambiguities and streamline data utilization. A contractual clause mandating ISO 8000-115 compliant identifiers represents a tangible step towards achieving guaranteed data quality, cost reduction, and enhanced operational efficiency.

A call for digital transformation
The persistent reliance on spreadsheets for managing SPIR documentation in an era when digital data standards are available is perplexing. The transition to a digital data exchange service, underpinned by international standards like the ISO 8000 series, offers a promising solution to the entrenched issues of data quality and efficiency in spare parts management. This digital transformation, initiated through strategic contractual requirements, paves the way for operational excellence in all capital projects, whether in asset intensive industries, or regular manufacturing facilities.

About the author
Peter Eales is a subject matter expert on MRO (maintenance, repair, and operations) material management and industrial data quality. Peter is an experienced consultant, trainer, writer, and speaker on these subjects. Peter is recognised by BSI and ISO as an expert in the subject of industrial data. Peter is a member ISO/TC 184/SC 4/WG 13, the ISO standards development committee that develops standards for industrial data and industrial interfaces, ISO 8000, ISO 29002, and ISO 22745. Peter is the project leader for edition 2 of ISO 29002 due to be published in late 2020. Peter is also a committee member of ISO/TC 184/WG 6 that published the standard for Asset intensive industry Interoperability, ISO 18101.
Peter has previously held positions as the global technical authority for materials management at a global EPC, and as the global subject matter expert for master data at a major oil and gas owner/operator. Peter is currently chief executive of MRO Insyte, and chairman of KOIOS Master Data.
KOIOS Master Data is a world-leading cloud MDM solution enabling ISO 8000 compliant data exchange
MRO Insyte is an MRO consultancy advising organizations in all aspects of materials management
Contact us
KOIOS Master Data are experts in this field. Give us a call and find out how we can help you.
+44 (0)23 9434 0000